Ceci n’est pas une pipe: Disentangling measurement and reality in ex-post harmonization

The scores in our dataset are not reality itself; they are glimpses at reality through the lens of the respective measurement instrument. In research practice, that distinction sometimes takes a backseat. However, if we want to combine numerical scores of different instruments, then the relationship between measurement and reality becomes crucial.
Die Werte in unserem Datensatz bilden die Realität nur mittelbar ab; sie erlauben uns lediglich den Blick durch die Linse des jeweiligen Messinstruments. In der Forschungspraxis tritt dieser Aspekt meist in den Hintergrund. Wenn wir jedoch numerische Werte, die mit verschiedenen Instrumenten gemessen wurden, kombinieren wollen, dann ist diese Beziehung zwischen Messung und Realität von zentraler Bedeutung.
DOI: 10.34879/gesisblog.2020.29
As René Magritte reminds us: Images are not to be confused with the object they represent. And quite similarly, measurements of reality are not reality itself. This becomes especially important in ex-post harmonization. After all, to ensure that two instruments deliver comparable measurements, we must understand how they relate to the concept they seek to capture. In last month’s post, we explored this idea by asking how we can determine if two instruments measure the same concept. This month, we go one step further: Even if two measurement instruments capture the same concept, they will most likely differ in their numerical format (or their measurement units, so to speak).
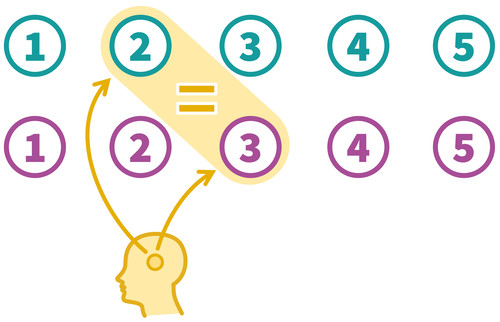
The problem of equity: 3 = 3?

Consider the following ex-post harmonization challenge: You have two instruments that both capture respondents’ level of social trust. However, they differ in their question-wording. How can we then ensure a crucial quality characteristic of successful ex-post harmonization:
Respondents who are the same with regard to the measured concept should (on average) be represented with the same numerical value in a harmonized variable, regardless of the source instrument or source survey (adapted from 1).
For example, after ex-post harmonization, a “3” in the harmonized social trust variable should represent the same level of social trust regardless of the source instrument used to measure social trust. Unfortunately, we do not have access to respondents’ true level of social trust, only their response scores in the data. To achieve the numerical comparability we want, we must disentangle the underlying concept expression (reality) from the influence of the measurement instrument. In this post, we will discuss some theoretical concepts and ideas of how to approach this challenge. In the next three posts, we will apply these ideas in more practical terms.
Laterna Magica:
Projecting reality onto a numerical canvas

If we want to disentangle measurement (the raw scores in our source data) from reality (respondents’ actual construct intensity), we need an intuition of how numerical scores and the underlying concept relate to each other. For our purposes, I like to imagine that the measurement instrument projects the inner workings of respondents onto the canvas of our response scale. This is, of course, an oversimplification. Respondents play a very active role, and their cognitive processes are certainly not so mechanistic 2. Think of socially desirable responding or satisficing. However, such systematic biases are problems of validity and thus conceptual comparability, as discussed last month. For now, let us assume that respondents understood our carefully crafted questions correctly and that they answered carefully and truthfully. If that is the case, it helps to think of measurement instruments as projecting expressions of a continuous latent construct onto an ordinal scale. Now to deconstruct this idea:
1. Continuous constructs

Many latent constructs in the social sciences can be thought of as continuous. For example, even if two people have very similar levels of trust, it is always imaginable to find a person with a trust intensity in between the two. So, there are no “types” or distinct groups. Instead, we have a smooth gradient from very little to very much trust. Even concepts that seem dichotomous (e.g., agreement to a statement) can be thought of as a continuous spectrum representing an intensity gradient or an (un-)certainty gradient. (As a side note: I use a normal distribution curve as a visual stand in for the population distribution of a latent variable. But latent variables do not have to be normally distributed and the argument developed here works for other distribution shapes as well.)
2. Continuous construct to discrete scores

Survey measurement instruments usually measure such continuous constructs with a finite number of discrete scores. A simplified way to think about it is that the measurement instrument cuts the continuum of the construct with thresholds (the dashed lines) into segments 3. Respondents in each segment will then most likely choose the corresponding response score. Respondents with very low social trust will most likely choose a “1”, those with a bit more social trust a “2” and so on.
3. Ordinal Scores

The numerical scores are ordinal. This means that each numerical score can be brought into sequential order: “1” signifies a lower trust than “2” and so on. However, each numerical score represents differently sized “chunks” of the continuum. In other words, the thresholds that govern which response options are chosen at a given construct intensity are not equally far apart. Different instruments can have wildly different thresholds depending on question-wording as well as the number and labeling of response options.
If you find this idea strange, be assured that I did not invent it. Instead, this (simplified) idea is an integral part of many approaches in survey methodology and psychometry. Factor analysis estimates such thresholds for “categorical” items (i.e., items with few response options) 4. And if we replace the hard thresholds with softer, probabilistic transitions between response options due to random response error, we have arrived at Item Response Theory Models 5. The logic also happens to be a core part of equipercentile equating 6; a harmonization approach we will discuss in the post planned for March 😊.
Linking the unobservable

Ensuring that different measurement instruments are aligned in their measurement units is a problem many sciences share. However, if we measure manifest phenomena, such as temperature, we can calibrate instruments by measuring known phenomena. For example, a thermometer can be calibrated by anchoring its measurements to the freezing and boiling points of water (or between the freezing point of an ammonium chloride brine and the human body temperature, if you prefer). With latent constructs, however, solutions are less straightforward. We cannot calibrate our survey instruments by anchoring them to the true, known construct intensities of specific respondents. Latent constructs are, after all, unobservable. Instead, we must infer how different instruments relate to each other indirectly.
Person link
The most obvious approach is what I like to call the person link. To discover how people with the same construct intensity answer different instruments for that construct, we can let respondents answer both instruments 7We do not know their true intensity, but we know that the intensity is the same because the person is the same. If a respondent chooses a “3” in one instrument and a “2” in the other, it suggests that the two scores represent roughly the same intensity. There are some technical considerations to be made, of course. We would need enough respondents to counteract random response error. Respondents also should cover the whole range of construct expressions we are interested in. For example, if we just ask people with high values in social trust, we cannot translate instrument scores in lower construct ranges. We also must mitigate question order effects 8. Asking respondents very similar questions one after the other means that instruments shown later are affected by previous ones. Prior questions may influence how later questions are interpreted. Longer sequences of instruments may also induce monotony, fatigue, and eventually irritation. Potential counterstrategies are mixing questions thematically, spacing them across a survey, and randomizing the order in which instrument variants are presented. However, the greatest drawback of this approach for ex-post harmonization projects is that we would probably have to collect additional data just to harmonize the instruments.
Population link

In what I call the population link approach, we apply different instruments not to the same respondents but to respondents randomly drawn from the same population 9. In essence, we apply the logic of a random experiment. Imagine a split-half experiment where respondents randomly either see one instrument or the other. If N is large enough, then respondents’ characteristics should be very similarly distributed in both experimental conditions. This means that the latent construct we want to measure is also similarly distributed in both groups. Now, if we measure with different instruments in both groups, we will most likely get two different response distributions. However, since we know that the underlying latent construct is similarly distributed, we can infer that response distribution differences are due to the measurement instruments. The two instruments simply “project” the same latent distribution differently onto different numerical scales. Consequently, we can harmonize the numerical scales so that similar numbers again reflect similar construct intensities. And in later blog posts (planned for February and March) we will do that practically.
However, it still seems as if we need to collect additional data: This time as a methodological experiment. However, all we need are random samples drawn from the same population. And two probabilistic surveys covering the population in a country (and in roughly the same year) are arguably just that: Two random samples from the same population. If we harmonize larger multi-wave surveys, chances are you might find such a link Also consider that we can use the time series of other surveys to bridge gaps in time. Imagine if we want to harmonize a more recent survey instrument A last used in 2016 with an older instrument B last used in 2012. Perhaps there is another survey which happened to measure the construct in both those years. Then we can align instrument B in 2012 with the other survey’s instrument, and then align that other survey’s instrument with instrument A with data from 2016 (see the image below for an illustration). Finding such links can also be automated in part. In a post later in 2021, I will discuss time-saving technical solutions.

Summary
In this post, we explored the problem of aligning numerical scores measured with different instruments. The end goal is to harmonize scores so that the same number implies the same construct intensity, regardless of source survey or source instrument. Ensuring such numerical comparability can be done if we have data where the same respondents answered different instruments capturing the same construct. However, it can also be done if we have random samples from the same population for each instrument, e.g., in probabilistic general social surveys. These ideas lay the groundwork for practical and efficient solutions in ex-post harmonization that we will discuss in 2021. As always, I welcome comments and criticism below or via email. In the meantime, happy holidays!
References
- Kolen, M. J., & Brennan, R. L. (2014). Test Equating, Scaling, and Linking (3rd ed.). Springer
- Tourangeau, R., Rips, L. J., & Rasinski, K. A. (2000). The psychology of survey response. Cambridge University Press.
- Raykov, T., & Marcoulides, G. A. (2011). Introduction to Psychometric Theory. Routledge
- Raykov, T., & Marcoulides, G. A. (2011). Introduction to Psychometric Theory. Routledge
- Moosbrugger, H., & Kelava, A. (2012). Testtheorie und Fragebogen-konstruktion (2nd ed.). Springer.
- Kolen, M. J., & Brennan, R. L. (2014). Test Equating, Scaling, and Linking (3rd ed.). Springer
- Kolen, M. J., & Brennan, R. L. (2014). Test Equating, Scaling, and Linking (3rd ed.). Springer.
- Tourangeau, R., Rips, L. J., & Rasinski, K. A. (2000). The psychology of survey response. Cambridge University Press.
- Kolen, M. J., & Brennan, R. L. (2014). Test Equating, Scaling, and Linking (3rd ed.). Springer
3 comments